

Cốt truyện phụ Matplotlib
Hiển thị nhiều ô
Với hàm subplot() bạn có thể vẽ nhiều ô trong một hình:
Ví dụ
Vẽ 2 đồ thị:
import matplotlib.pyplot as plt
import numpy as np
#plot 1:
x =
np.array([0, 1, 2, 3])
y = np.array([3, 8, 1, 10])
plt.subplot(1, 2, 1)
plt.plot(x,y)
#plot 2:
x = np.array([0, 1, 2, 3])
y = np.array([10, 20, 30,
40])
plt.subplot(1, 2, 2)
plt.plot(x,y)
plt.show()
Kết quả:

Hàm subplot()
Hàm subplot() nhận ba đối số mô tả bố cục của hình.
Bố cục được sắp xếp theo hàng và cột, được biểu thị bằng đối số thứ nhất và thứ hai .
Đối số thứ ba đại diện cho chỉ mục của biểu đồ hiện tại.
plt.subplot(1, 2, 1)
#the figure has 1 row, 2 columns, and this plot is the first plot.
plt.subplot(1, 2, 2)
#the figure has 1 row, 2 columns, and this plot is the second plot.
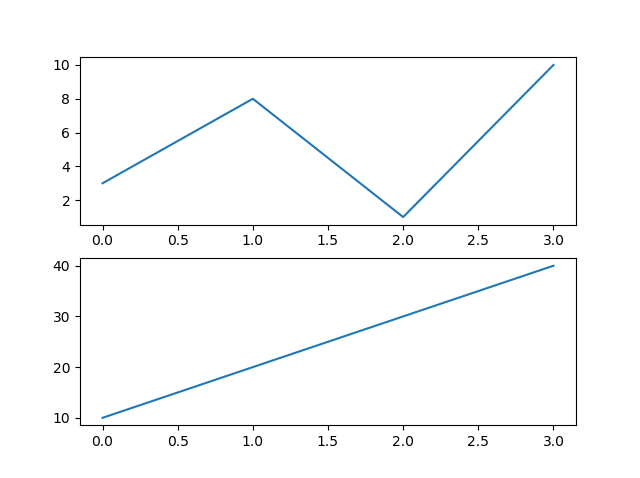
Vì vậy, nếu chúng ta muốn một hình có 2 hàng một cột (nghĩa là hai ô sẽ được hiển thị chồng lên nhau thay vì cạnh nhau), chúng ta có thể viết cú pháp như sau:
Ví dụ
Vẽ 2 ô chồng lên nhau:
import matplotlib.pyplot as plt
import numpy as np
#plot 1:
x =
np.array([0, 1, 2, 3])
y = np.array([3, 8, 1, 10])
plt.subplot(2, 1, 1)
plt.plot(x,y)
#plot 2:
x = np.array([0, 1, 2, 3])
y = np.array([10, 20, 30,
40])
plt.subplot(2, 1, 2)
plt.plot(x,y)
plt.show()
Kết quả:
Bạn có thể vẽ bao nhiêu ô tùy thích trên một hình, chỉ cần mô tả số hàng, cột và chỉ số của ô.
Ví dụ
Vẽ 6 ô:
import matplotlib.pyplot as plt
import numpy as np
x = np.array([0,
1, 2, 3])
y = np.array([3, 8, 1, 10])
plt.subplot(2, 3, 1)
plt.plot(x,y)
x = np.array([0, 1, 2, 3])
y = np.array([10, 20, 30,
40])
plt.subplot(2, 3, 2)
plt.plot(x,y)
x = np.array([0, 1,
2, 3])
y = np.array([3, 8, 1, 10])
plt.subplot(2, 3, 3)
plt.plot(x,y)
x = np.array([0, 1, 2, 3])
y = np.array([10, 20, 30, 40])
plt.subplot(2, 3, 4)
plt.plot(x,y)
x = np.array([0, 1, 2, 3])
y =
np.array([3, 8, 1, 10])
plt.subplot(2, 3, 5)
plt.plot(x,y)
x
= np.array([0, 1, 2, 3])
y = np.array([10, 20, 30, 40])
plt.subplot(2,
3, 6)
plt.plot(x,y)
plt.show()Kết quả:

Tiêu đề
Bạn có thể thêm tiêu đề cho mỗi ô bằng title() :
Ví dụ
2 lô đất có tên:
import matplotlib.pyplot as plt
import numpy as np
#plot 1:
x =
np.array([0, 1, 2, 3])
y = np.array([3, 8, 1, 10])
plt.subplot(1, 2, 1)
plt.plot(x,y)
plt.title("SALES")
#plot 2:
x = np.array([0, 1, 2, 3])
y = np.array([10, 20, 30,
40])
plt.subplot(1, 2, 2)
plt.plot(x,y)
plt.title("INCOME")
plt.show()
Kết quả:

Siêu danh hiệu
Bạn có thể thêm tiêu đề cho toàn bộ hình bằng hàm suptitle() :
Ví dụ
Thêm tiêu đề cho toàn bộ hình:
import matplotlib.pyplot as plt
import numpy as np
#plot 1:
x =
np.array([0, 1, 2, 3])
y = np.array([3, 8, 1, 10])
plt.subplot(1, 2, 1)
plt.plot(x,y)
plt.title("SALES")
#plot 2:
x = np.array([0, 1, 2, 3])
y = np.array([10, 20, 30,
40])
plt.subplot(1, 2, 2)
plt.plot(x,y)
plt.title("INCOME")
plt.suptitle("MY SHOP")
plt.show()
Kết quả:

